Ahead of the Curve: Factoring the Cost of Carbon into Long-Term Decision-Making
INTRODUCTION
Decarbonization is a major investment theme for long-term investors, given the worldwide shift already under way in energy infrastructure, transportation, agriculture, business models, and the built environment. Annual climate finance surpassed $1 trillion in 2021 and has been climbing since.[1] Renewable energy generation will meet 35 percent of global demand by 2025; that mix was just 19.5 percent in 2010.[2] Investment flows contrast with the global cost of climate change damages, which could range between $1.7 trillion and $3.1 trillion per year by 2050.[3]
Climate-related risks will have far reaching implications for the long-term investment portfolios of sovereign wealth funds, pension funds, insurance companies, and endowments. A recent survey of 200 asset owners found that 56 percent plan to increase climate investment over the next 1-3 years, and 46 percent said that navigating the transition is their most important investment priority over the same period.[4]
Despite momentum, progress feels incremental. Today’s volatile political and geopolitical context has upended climate and industrial policy, creating significant uncertainty for long-term investors. A reshuffling of global trade and supply chains also means a reshuffling of where emissions occur. To be clear, the climate transition was never assumed to progress in a linear fashion. At times, decarbonization pathways may appear to stagnate or even move in the wrong direction. While various regions are at different points in implementing climate policies, greater policy uncertainty has the effect of widening potential outcomes.
Investors are probably wondering, where do we go from here?
Successful long-term investing is built around having a future view of risks and opportunities, including how climate policy and regulations will affect future investment, and in particular, how economies move to price carbon emissions. This paper will provide a fresh look at how asset owners can approach risks and opportunities in the climate transition, by focusing on carbon price risk and how the cost of carbon could affect portfolios over the long run. The end of this chapter contains toolkits for asset owners and investors to facilitate analysis of transition risk in portfolios.
Straight talk on climate risks and opportunities
Imagine a market where the trajectory is unclear. It’s changing rapidly, and the instruments and rules are new and different. There may be disparate prices in different jurisdictions for the same instrument, while opportunities for making money seem overlooked. Is it high yield bonds or mortgage-backed securities in the 1980s? Hedge funds or emerging markets in the 1990s?
Carbon markets today evoke that feeling – they’re nascent and perhaps even inefficient. They possess the ingredients that attract market participants and support the search for alpha, through unique insights, due diligence, and data analysis.
Carbon markets and the cost of emissions within them are not a requirement or a commitment made by investors, but rather present as a financial input in computing future risk and return opportunities. Just as interest rates, inflation, growth, and other key macro-economic factors serve as building blocks for evaluating asset allocation, real estate deals, infrastructure and private equity, the cost of carbon can also serve as an input in the investment process. Specifically, a view on where carbon markets and policy are going, and how that could affect cash flows of investments over various time horizons.
The entire investment industry is built around having a future view on macro-economic factors, yet there seems to be a prevailing thought in financial markets that the cost of emissions is far off in the future. But the future can sneak up on you, and no investor likes to be caught off guard. Investors may be happy collecting interest and dividends now, but if they’re unprepared, portfolios will not be resilient to shocks in carbon markets.
Asset owners are in a unique position
Asset owners that are ahead of the curve assess the cost of carbon as a financial input for transition plans, strategy, and risk assessment, regardless of their location, political views, or whether there is a net-zero commitment or not. Asset owners are at the center of a “value chain” of investment activity: they invest in companies and assets directly that generate emissions or hire external asset managers to invest on their behalf.
Asset owners are currently navigating a period where parts of their portfolios may reflect the economics of carbon emissions, while others may not. In Decarbonizing Long-term Portfolios, FCLTGlobal research found that an adaptable, top-down approach to decarbonization provides long-term investors with multiple levers for addressing climate risk inside their investment portfolios while fulfilling their purpose and capitalizing on new opportunities.
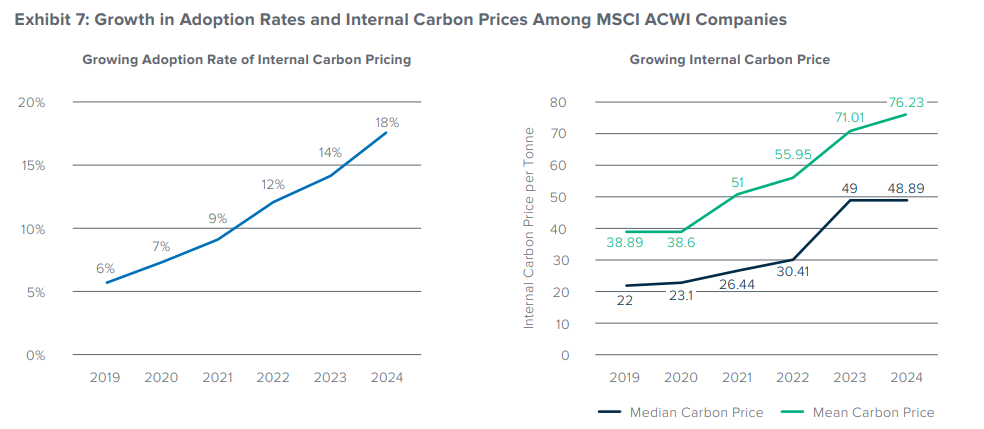
The companies that asset owners invest in may or may not use internal carbon prices (ICPs) or shadow carbon pricing to reflect the cost of emissions over time, or they may be subject to regulated carbon prices. A recent FCLTGlobal study found that 14 percent of MSCI ACWI companies reported using an internal carbon price. This was up from just 5 percent five years ago.
The asset managers that asset owners hire serve as a bridge between portfolio companies and owners, on issues like strategy, company engagement, investment selection, and due diligence. Effective investment mandate design holds managers accountable to the owner’s expectations and views on climate change. Institutional Investment Mandates: Anchors for Long-Term Performance provides tools for asset owners and managers to create mandates that align both parties on long-term goals, including sample mandate terms that consider climate objectives.
Investors face a patchwork of global policy and regulations
Today, the world is at different points on internalizing the economics of emissions. One study places the global average price of carbon at around $23 a ton in 2023,[5] while it is estimated that just 24 percent of global emissions are covered by direct or indirect pricing measures.[6] Analysis from the World Bank Group includes measures such as direct carbon taxes, fuel taxes, and emissions trading schemes (ETS), net of fuel subsidies (exhibit 1). The majority of emissions pricing has been through fuel taxes, with ETS a small but growing portion.

Policy sets the backdrop to climate action, yet regulatory treatment of carbon emissions is uneven around the world. Furthermore, carbon markets exist as mandatory (compliance) schemes as well as voluntary programs. Economists debate the merits of implementing quantity-based instruments (ETS), or price-based (fuel taxes) policies, without a strong consensus on an optimal approach for adoption in the current context.[7] Green incentives and decarbonization subsidies, like tax credits for clean energy investment, have also been a major factor in shaping markets. As a result, investors face the challenge of investing in markets at various stages of developing their domestic policies for pricing carbon emissions. Are we in the midst of a “carbon carry trade” where capital is drawn to regions where emissions are relatively underpriced compared to regions where the cost of carbon is internalized by markets?
It is a fast-evolving landscape, with policy taking steps forwards and backwards. Yet momentum has been building in local markets. The global value of traded carbon dioxide (CO2) permits reached a record $948.75 billion in 2023, while 12.5 billion metric tons of carbon permits changed hands.[8] Exhibit 2 shows regions around the world that have implemented various policies to capture the cost of carbon in emissions.

Even since this graphic was produced in May 2024, major markets have implemented pricing mechanisms. Brazil established the Brazilian Greenhouse Gas Emissions Trading System in November 2024, to be phased in over the next five to six years.[9] Indonesia has been advancing cap-and-trade with plans to expand coverage to industrial sectors.
Investors are closely following developments in the European Union and its Emissions Trading System, which is set to decrease the quantity of free emissions allowances, leading to potentially higher prices over time. New mechanisms are arising, such as carbon tariffs, which require importers to pay the same carbon prices as domestic producers to reduce “carbon leakage”. The first carbon-tariff system, the EU Carbon Border Adjustment Mechanism (CBAM), takes effect in October 2023 for reporting purposes, and becomes chargeable in January 2026.[10] CBAM has the potential to significantly influence market development as it serves as an incentive for other countries to price emissions. Why would a country let other governments collect revenues that they could be collecting on local production that is exported to the EU?
Understanding the barriers to evaluating the cost of carbon for portfolios and assets
FCLTGlobal convened members for a working group in Q4 2024, with asset owners and asset managers sharing their experiences on the theme of climate change and managing transition and physical risks in portfolios. Member CEOs met at FCLTGlobal’s annual Summit in January 2025, where the subject of addressing future climate costs featured in the agenda. CEOs were concerned with carbon pricing realities and how low carbon prices translate into weak investment signals. They also highlighted the benefits of scenario planning based on climate science fundamentals – actual levels of CO2 in the atmosphere and projections going forward. Several things stood out from these discussions, including:
- Uncertain financial impact – Regulatory uncertainty and the timing of policy development complicate short- and long-term capital allocation decisions. Individual company responses, as well as decarbonization pathways and how emissions cost will affect future earnings also contributes to financial uncertainty. An investor may determine little impact to future earnings, if, for instance, companies can pass through higher costs of carbon to consumers. Pass-through strongly depends on the market structure and the supply-demand equilibrium.[11]
- Low confidence in financial assumptions – Uncertainty around the trajectory and level of carbon prices leads to lower confidence in risk/ return assumptions. Low confidence in assumptions means that information output from models, scenario analysis, and due diligence does not significantly impact or influence investment decision making. There is no singular quantitative model or approach that fully captures the risk of carbon in portfolios. For analyzing real estate investment like a building, it’s more straightforward. A business, with complex supply chain, shipping routes, and energy sources, is much more complicated.
- Focus on immediate financial performance – Some investors fall into the trap of prioritizing short-term financial performance. While carbon prices are comparably low in the current environment, assuming they will be low forever could expose portfolios to future shocks.
- Cost and complexity – While disclosures have been improving, data collection and management as well as the complexity of measuring emissions has been a challenge for investors. Not all companies globally report on their emissions, requiring estimation methods in some instances. Yet you could also say that there is too much data, which makes focusing on what is material and impactful to a business more difficult to process and interpret.
STAYING AHEAD OF THE CURVE
The cost of carbon, reflected as a price per ton of emissions, is a critical financial input.
68 percent of financial professionals in a recent survey believe that climate risk is mispriced in the stock market.[12] Investors clearly grapple with uncertainty about the future path of climate change, the energy transition, policy parameters and adaptation by firms and households.[13] Market pricing is also hampered by a lack of historical data, consistent methodologies, standardized metrics, and comparable disclosures around climate risks.[14]
There is a real risk of underestimating – or overestimating – the cost of emissions and its impact on asset prices, but that doesn’t mean it should be left out of the formula. Effective processes place less of an emphasis on accurately forecasting future carbon costs, and more on developing fundamental analysis around policy, market development, and company response, with an objective of embedding those views in decision making. Few investors accurately forecast the path for interest rates, yet that doesn’t mean investors shouldn’t develop views on how central banks may set monetary policy.
Not all emissions are the same
Measuring portfolio emissions is a daunting task. A number of asset owners and asset managers have developed methodologies to measure their carbon footprints – there are plenty of good practices for investors to follow in this regard. Yet there are gaps in that reporting, in asset classes like private equity where data may not be available, or other blind spots to consider. Ask an investor how confident they are in their assessment of carbon footprint and you may get a caveated answer.
In developing decarbonization scenarios and cost scenarios, investors could make some simplifying assumptions (Exhibit 3). Considered to be mostly part of Scope 1 or 3, Unabatable emissions are the emissions that are too costly to reduce or eliminate, or there isn’t yet a technological solution to reduce them. These are the emissions that a company ends up paying for, affecting earnings. Scope 2 emissions would eventually be mitigated through the decarbonization of energy systems, with potential cost pass-through. As one investor put it at FCLTSummit 2025, “Would you rather own 1 ton of Scope 1 emissions, 5 tons of Scope 2, or 1 ton of Scope 3. I would take Scope 2 emissions because Scope 1 are hard to abate, the value at risk comes from Scope 1.” The source of emissions really matters: a company or asset with high Scope 1 will be more sensitive to the price of carbon, with an asset valuation as a function of how difficult they are to abate or mitigate.

Climate winners and losers
Building on the concept of asset valuation sensitivity to emissions, carbon pricing can be used to uncover which companies or assets are poised to benefit from higher carbon prices, and which will be harmed. Just as one can view that owning shares in an oil company is like being long the price of oil, it’s also tantamount to being short the price of carbon. The higher the price of carbon, the higher the risk to earnings of unmitigated emissions. The same can be said for companies that are “long carbon prices.” Depending on whether the price of carbon reflects a cost, or is a source of revenue, it’s like having a short or long call option on the price of carbon embedded in your portfolio.
Tesla, which only manufactures electric vehicles, has earned billions of dollars selling emissions credits to other automakers, collecting $2.1 billion in the first nine months of 2024 alone, which was 43 percent of net profit.[15] Carbon credits have been a key revenue driver for the automaker, even as other automakers have struggled to meet regulated emissions targets. A long/short mindset to the price of carbon reinforces the view that the price of carbon is a financial input or indicator in valuing an asset and recognizes that there will be winners and losers as carbon prices fluctuate.
The market seems to overlook the possibilities of technological developments, especially in the energy sector, which could put downward pressure on carbon prices. Investing in low carbon technologies and research and development holds the potential to deliver winners and reduce carbon risk in portfolios.
Financial tools in carbon markets are improving
The investment industry spends significant time and resources developing forward-looking views on key financial variables, the price of carbon is just another to add to that mix. As carbon markets continue to mature, several developments in financial markets have supported investors and companies in managing risks. The emergence of derivatives markets is one such development. Futures and options markets volumes for the EUA, UKA, CCA, and RGGI, the largest cap and trade markets in the world, have been increasing (Exhibit 4).[16]

Broadly speaking, derivatives aid in the allocation of risks and provide tools for companies and investors to manage risks, and they can lower the cost of diversifying portfolios. It is also a compliance tool for meeting emissions caps placed on regulated entities. Companies can lock-in prices on their future carbon emissions through derivatives markets. Investors can trade derivatives contracts, speculate on prices, search for arbitrage opportunities, or hedge portfolio exposures. Negative carbon convenience yields have attracted the attention of carbon traders interested in exploiting arbitrage opportunities between carbon spot and futures markets.[17] Furthermore, Investors can use price signals from carbon derivatives to assess climate transition risk in their portfolios.[18]
The forward price curves of futures contracts offer market views on the future price of emissions and is analogous to the term structure of interest rates (Exhibit 5). Although academic research in commodities markets finds that futures prices have not been reliable predictors of subsequent price movements,[19] derivatives markets do provide a complementary source of information for investors to analyze.

APPROACHES TO INTEGRATE RISKS AND OPPORTUNITIES IN PORTFOLIO INVESTMENT DECISION MAKING
Given significant uncertainty in climate change policy, geopolitics, technology, and in some cases, backlash against sustainability initiatives, asset owners and long-term investors would benefit from a “reboot” of their approach to managing risks and opportunities resulting from climate change. Despite the near-term uncertainty, investors able to think long-term enough acknowledge the risk that the cost of carbon places on portfolios.
A recent study combining climate scenario analysis with assessments of impacts on firm revenues and operating costs—capturing both winners and losers—found that aggregate losses on an equity portfolio composed of MSCI World Index companies could range from 0.5 to 6.0 percent.[20] Sector-specific losses were found to be much higher, reaching as much as 10 percent to 60 percent in vulnerable industries such as utilities.
One firm’s added cost could become another firm’s added revenue. As such, investors need forward-looking measures of transition risk and opportunity, that are flexible enough to apply to multiple scenarios, and that highlight the upside and downside to companies and industries.
A handful of leading investors have developed tools
Investors that are ahead of the curve have defined approaches to climate risk and opportunity, integrating tools into investment strategy and decision making. Investors recognize that we are in a period where not all parts of their portfolio reflect the economics of carbon prices. Some leading examples from asset owners include:
– Temasek. Singapore’s currently applies an internal carbon price (ICP) of $65 per tCO2e to embed the cost of carbon in its investment and operating decisions, and to further align its portfolio and business to the company’s net zero target.[21] Review of the ICP is performed every two years, and takes into account carbon price projections by international bodies. Temasek has also developed a proprietary metric called the “carbon spread”, which reflects its ICP modelled as a spread on top of its risk-adjusted cost of capital, acting as a trigger for deeper analysis into the climate transition and decarbonization plans of prospective investee companies.[22]
– GIC, also of Singapore, has published research on carbon markets and investment portfolio analysis. Carbon Earnings-at-risk Scenario Analysis (CESA) is a forward-looking risk measure that estimates the portfolio’s value at risk due to carbon prices.[23] The tool can be incorporated directly into companies’ valuation analyses and is combined with a scenario analysis approach for assessing carbon earnings-at-risk at the total portfolio level, helping to identify specific areas of vulnerabilities within the portfolio for deeper due diligence. GIC finds that carbon price impact varies widely across climate scenarios, ranging from 0 percent to 14 percent for a global equities portfolio tracking the MSCI All Country World Index.
– Norway’s Norges Bank Investment Management (NBIM) estimates net portfolio losses associated with different climate scenarios using MSCI’s Climate Value at Risk (CVaR) model.[24] CVaR is a bottom-up model that approximates the net climate costs of each individual portfolio company, rolling them up to the portfolio level. In broad terms, the loss estimates are the discounted sum of portfolio losses until 2080 associated with climate policy risk, technological opportunities, and physical climate impacts. Based on NBIM’s global equity investments at the end of 2024, the cumulative impact of climate change on the portfolio’s value by 2080 across various scenarios is estimated to result in a reduction ranging from 2 to 10 percent of present value, and 2 to 8 percent when technology opportunities are considered.
Striking the right balance
This report highlights several approaches, in the following toolkits, that enable asset owners and investors to “reboot” their assessments of climate risks and opportunities. During working groups, we heard from participants that striking the right balance between complexity and simplicity of tools was important. Complex methodologies benefit from additional rigor, yet it’s not necessarily precision that is required, but better guidance. Complex tools can be more costly to research and populate and can also be more difficult for investment committees and boards to interpret. Simpler methodologies are easier to accomplish and are less resource intensive and can be easier for investment decision makers to interpret. Although even simple approaches require a certain amount of rigor to support sound decision making.
CONCLUSION
The cost of carbon is no longer a hypothetical concern— it is a material financial input that will increasingly shape the investment landscape. As the global climate transition accelerates, asset owners and investors must adapt to a world where carbon pricing is fragmented but gaining traction. Integrating transition risks into financial decision-making, even amid uncertainty, is vital for building resilient portfolios. This involves not only recognizing which companies and sectors are most exposed to emissions costs but also identifying those poised to benefit from the shift to a low-carbon economy. Tools such as carbon beta, NoCEBITDA, and scenario-based valuation adjustments provide practical entry points for making climate risk analysis more actionable and investment-relevant.
Ultimately, the climate transition is not just a risk to manage, but an opportunity to seize. Investors ahead of the curve are rethinking valuation methods, developing forward-looking tools, and embedding carbon cost assumptions into strategic investment decision making. By reframing carbon as a dynamic financial variable— similar to interest rates or inflation—long-term investors can better navigate an uncertain policy environment and uncover opportunities in a rapidly evolving world.
TOOLKIT: INDICATORS FOR SCENARIO ANALYSIS
This toolkit focuses on indicators that align with already established investment methodologies and concepts, essentially building on the “finance language” and expertise that committees and boards already possess, while applying it to climate concepts. These indicators are based on readily available data and disclosures and can complement climate scenario analysis using different assumptions on carbon price levels.

Market-implied cost of hedging carbon price exposure: Similar to insurance for physical climate exposure, this indicator asks what the cost is to insure against transition risks for asset classes and individual assets with exposure to carbon price risk. The estimated cost to hedge carbon exposure can be used as a “haircut” to prospective returns, in order to map transition risks in equity industries and investments in private equity and real assets. The implied cost to hedge risks can be computed for an individual company, or at the sector/aggregate level, using underlying assumptions of unabated emissions, or emissions exposed to price risk. One study has found that the cost of hedging tail risks using options, on average, amounts to 2 percent of portfolio assets per year. [25]
NoCEBITDA – Net of Carbon Earnings Before Interest, Taxes, Depreciation, and Amortization: Carbon price risk can leave exposure to fluctuating costs, leading to volatile earnings. Estimations can also include sources of “green revenues” where companies are poised to benefit from higher carbon prices. Carbon adjusted EBITDA over multiple periods forms the basis of valuation models, which makes this tool well suited to analyze private equity, real estate, and infrastructure deals.
Carbon-adjusted financial indicators, EPS, ROI, IRR: Adjusting EBITDA for carbon-related costs and changes in revenue can serve as a basis for calculating other financial indicators, notably earnings per share (EPS), return on investment (ROI), and internal rates of return (IRR) with applications in both public and private markets.
TOOLKIT: CARBON BETA
Carbon beta is a tool designed to measure transition risk in individual stocks and portfolios of stocks. It is a forward-looking measure that determines the extent to which an asset’s price correlates with a carbon risk factor.
The beta of a stock is a traditional finance indicator of risk with a long academic history, and is a concept well understood in the finance world. It simply measures how the value of a stock or portfolio of stocks moves in relation to the market. For the purpose of computing carbon beta, the “market” is redefined as a group of high emitting stocks believed to possess high climate risk and face potential high costs for abating emissions. The carbon beta of an individual stock or portfolio is its valuation in relationship to the carbon risk portfolio. Huij et al. developed a methodology to estimate asset-level climate risk exposure by regressing stock returns on a pollutive-minus-clean portfolio.[26] The authors find that, not surprisingly, climate risk is highest in energy and utility sectors, and lowest in healthcare and financials.
The methodology is relatively simple and straightforward, and investors can readily replicate it using existing historical market data and emissions and transition risk disclosures. Investors can even develop their own methodologies on how climate risk is defined in the “market” portfolio. For example, the pollutive-minus-clean portfolio assumes that all emissions are the same, while investors might assign greater weight to some emissions over others. For firms whose emissions occur in the production of goods that reduce emissions elsewhere (e.g. solar panels), or that operate in sectors for which abatement is expected to be easier, investors might perceive lower risk exposures.[27] Interestingly, Huij et al. find that returns to stocks with high carbon betas are lower during months in which climate change is more frequently discussed in the news, during months in which temperatures are abnormally high, and during exceptionally dry months.
Carbon beta can also be a tool to identify firms that are investing in green technologies. Green innovation is largely driven by firms in the energy sector, yet paradoxically these firms are generally amongst the worst performers on environmental issues.[28] Using green patents as an indicator, Huij et al. test the association of carbon beta with green innovation and find that green innovators are less exposed to climate risk, including firms in the energy sector.
Carbon beta is but one factor to analyze amongst many. It is an indicator that can be used in concert with other factors while recognizing how factors can interact.
INTRODUCTION – WHY CLIMATE EXTERNALITIES CAN’T BE IGNORED
Despite the policy uncertainty and differences around the world, understanding climate-related risks and opportunities is essential to effective long-term capital allocation. Just as interest rates, inflation, and geopolitical risks shape investment decisions, so too do emissions costs, insurance premiums, and the growing financial toll of climate change.[29], [30], [31]
The effects of climate have slowly manifested not only in transition risk (e.g. a grey premium for carbon-intensive sectors like oil and gas), but also in physical risk (e.g. depressed exit-multiples among real estate developments in climate-affected areas).[32], [33] While some companies still view such risks as immaterial to their strategy, over a long-enough horizon, these previously insignificant costs, are set to hit the bottom line at an ever-consequential rate.
|
Climate externalities are the unpriced costs or benefits of business activities that impact the climate system, such as greenhouse gas emissions, water usage, or land degradation.
These externalities vary by sector and jurisdiction but are increasingly prevalent worldwide. While some companies may currently view these risks as immaterial or choose to wait for regulatory developments, proactively addressing them (through, e.g. pricing carbon internally, hedging future climate risk, and scenario planning) can help manage uncertainty and enhance competitive positioning. Incorporating climate externalities into capital allocation decisions today—before they are fully reflected in regulations or markets—can enable companies to manage risks, seize opportunities, and build long-term resilience. While carbon emissions are among the most common and financially significant externalities, especially in emissions-intensive sectors, companies with inherently low carbon footprints—like those in software or professional services—may find other externalities more material. For instance, data centers operated by tech firms often consume substantial amounts of water for cooling purposes, which can strain local water resources, particularly in drought-prone regions. [34] |
Many of these climate externalities ultimately are internalized and show up in the economics of a project, whether through costs, pricing dynamics, or asset values. Whatever assumptions companies make about them will inevitably reshape the risk-return profile of their investments.
As such, identifying which climate externalities are material—when and where—and determining appropriate responses is a vital tool in helping companies stay ahead of the curve. By factoring future climate-related costs into investment decisions, companies can maximize long-term value.
In practice, the path to do so is complex. While some firms actively embed climate considerations into their capital allocation decisions, many still struggle to weigh long-term climate risks against short-term financial pressures—particularly when the costs of carbon remain uncertain or inconsistently applied.
Exhibit 6 (page 20) illustrates how emissions pricing might alter investment attractiveness between two hypothetical projects: when weighing two projects (A and B), their attractiveness to the company varies depending on whether the analysis factors in the future cost of carbon.
If emissions are priced for the long-term project A may make more sense over project B, and vice versa if emissions are free. In truth, many payoffs to these investments follow a “j-curve”: companies are faced with the decision to “pay now or pay later” when it comes to climate (and carbon especially).

This challenge is amplified by the fact that many of the tools and signals needed to inform long-term climate-adjusted decisions—such as internal carbon pricing, external regulatory coverage, and credible forward commitments—remain challenging to adopt or apply.
While still early days, a few key data points illustrate how this plays out across company practice, market coverage, and credibility:
- 18% of MSCI ACWI companies reported using an internal carbon price as of 2024. Among those that do, the median price is $49 per ton.
- 24% of global carbon emissions are currently covered by an emissions trading system (ETS) or carbon tax [35] —up from 13% in 2014.
- 26% of S&P Global BMI companies generated unpriced environmental costs that exceeded their net income—suggesting that externalities remain financially invisible in many corporate accounts. [36]
Evidence suggests that leading firms are increasingly developing internal views on climate externalities— particularly carbon—and are actively incorporating them into investment and strategy decisions. [37]
However, many others do not quantify or operationalize these externalities in capital allocation, especially in a time when carbon prices are uncertain, or policies are evolving. Deferring action altogether, adopting a “waitand-see” approach will lead companies to be behind the curve.

GETTING AHEAD OF THE CURVE IS EASIER SAID THAN DONE
Amid mounting short-term performance pressures and unclear financial payoffs, few companies meaningfully integrate climate considerations like carbon pricing into capital allocation decisions. [38], [39], [40], [41]
For the past 12 months, companies have been scaling back sustainability pledges, as many over-promised and under-delivered. [42] Companies have been called out for “greenwashing” and underperformance. [43]
Treating climate as a financial issue requires overcoming several key challenges that need to be overcome, as seen in the table below:

In such a challenging current environment, how can companies perform sufficiently now while keeping an eye toward the future, and what can investors do to support companies in their journeys, while fulfilling their mandates and fiduciary duty?
TURNING CLIMATE INSIGHTS INTO ACTION
As companies weigh near-term pressures against long-term climate strategy, many are seeking clearer direction—not in theory, but in practice. They want to know: Who is doing this well? What frameworks are working? And how can we make sound decisions amid evolving regulations and stakeholder expectations?
In our discussions with corporate and investor leaders, the message is consistent. Organizations are not just looking for metrics—they are looking for clarity. Clarity about how others are embedding climate into real capital allocation decisions. Clarity around how to navigate uncertainty across jurisdictions. And clarity about how to act decisively, without getting ahead of their boards or behind their peers.
The toolkits on the following pages aim to meet that demand. By showcasing leading company examples and practical tools—ranging from internal carbon pricing and marginal abatement cost curves to climate-adjusted financial metrics—we provide a set of forward-looking approaches for navigating uncertainty, aligning decisions with long-term value, and staying ahead of the curve.
CONCLUSION
To get ahead of the curve on climate, forward-thinking companies are integrating climate externalities into overall strategy and capital allocation.
Internalizing climate externalities like carbon is not a one-time fix—it requires ongoing recalibration of strategy, risk management, and investor communication. Organizations that begin now—by applying internal carbon pricing, stress-testing projects against future scenarios, and translating climate metrics into familiar financial language—will be better positioned to capture upside and avoid downside in a decarbonizing economy.
The future will reward those who align capital with long-term value creation. Getting ahead of the curve today means thriving in the economy of tomorrow.
Link to the full report can be found here.
1 Climate Policy Initiative, “Global Landscape of Climate Finance 2024”, 31 October, 2024. Link. (go back)
2 International Energy Agency, “The Global Power Mix Is Set to Transform by 2030”, Accessed 11 April, 2025. Link. (go back)
3 World Economic Forum, “Climate change is costing the world $16 million per hour: study”, 12 October, 2023. Link. (go back)
4 BlackRock, “Global perspectives on investing in the low-carbon transition”, 2023. Link. (go back)
5 Tiseo, Ian, “Weighted Average Direct Carbon Price Worldwide from 2020 to 2023”, 30 January 2025. Link. (go back)
6 World Bank Group, “State and Trends of Carbon Pricing”, 21 May 2024. Link. (go back)
7 Roncalli, Thierry, and Raphaël Semet, “The Economic Cost of the Carbon Tax”, Amundi Investment Institute, Working Paper 156, March 2024. Link. (go back)
8 Twidale, Susanna, “Global Carbon Markets Value Hit Record $949 Billion Last Year – LSEG”, Reuters, 12 February 2024. Link. (go back)
9 International Carbon Action Partnership, “Brazil Adopts Cap-and-Trade System”, 28 November, 2024. Link. (go back)
10 PwC, “The Hidden Cost of Carbon”, 19 October, 2023. Link. (go back)
11 Roncalli, Thierry, and Raphaël Semet, “The Economic Cost of the Carbon Tax”, Amundi Investment Institute, Working Paper 156, March 2024. Link. (go back)
12 Bauer, Rob, Katrin Gödker, Paul Smeets, and Florian Zimmermann, “Mental Models in Financial Markets: How Do Experts Reason about the Pricing of Climate Risk?”, IZA Discussion Paper No. 17030, 14 June 2024. Link. (go back)
13 Eren, Egemen, Floortje Merten, and Niek Verhoeven, “Pricing of Climate Risks in Financial Markets: A Summary of the Literature”, BIS Papers No. 130, December 2022. Link. (go back)
14 Bolton, Patrick, et al., “The Green Swan: Central Banking and Financial Stability in the Age of Climate Change”, BIS, January 2020. Link. (go back)
15 Davenport, Coral, and Jack Ewing, “Automakers to Trump: Please Require Us to Sell Electric Vehicles”, New York Times, 21 November, 2024. Link. (go back)
16 Futures and options contracts are linked to the European Union Allowance (EUA), United Kingdom Allowance (UKA), California Carbon Allowance (CCA), and Regional Greenhouse Gas Initiative (RGGI), collectively covering a majority of the world’s traded carbon allowances and credits. (go back)
17 Palao, Fernando and Angel Pardo, “The Inconvenience Yield of Carbon Futures”, September 2021. Link. (go back)
18 International Swaps and Derivatives Association, “Role of Derivatives in Carbon Markets”, September 2021. Link. (go back)
19 Nixon, Dan and Tom Smith, “What Can the Oil Futures Curve Tell Us about the Outlook for Oil Prices?”, Bank of England, 2012. Link. (go back)
20 Bouchet, Vincent, Thomas Lorens, and Julien Priol, “Beyond Carbon Price: A Scenario-Based Quantification of Portfolio Financial Loss from Climate Transition Risks”, Scientific Portfolio, January 2025. Link. (go back)
21 Temasek, “Sustainability Report 2025”. Link. (go back)
22 Temasek, “Sustainability Report 2025”. Link. (go back)
23 Teo, Rachel, De Rui Wong, and Lloyd Lee, “Carbon Earnings-at-Risk Scenario Analysis (CESA)”, GIC, 25 October 2022. Link. (go back)
24 Norges Bank Investment Management, “Climate and Nature Disclosures 2024”. (go back)
25 Chang, Linda, Jeremie Holdom, and Vineer Bhansali, “Tail Risk Hedging Performance: Measuring What Counts”, 18 November 2021. Link. (go back)
26 Huij, Joop, Dries Laurs, Philip Stork, and Remco C.J. Zwinkels, “Carbon Beta: A Market-based Measure of Climate Risk Exposure”, April 2024. Link. (go back)
27 ibid. (go back)
28 Cohen, Lauren, Umit G. Gurun, and Quoc H. Nguyen, “The ESG Innovation Disconnect: Evidence from Green Patenting”, National Bureau of Economic Research, Working Paper No. 27990, October 2020. Link. (go back)
29 Paul A. Griffin and Yuan Sun, “Climate-Related Financial Risk: Insights from a Semi-Systematic Review,” The International Journal of Accounting 56, no. 2 (2021): 1–25. Link. (go back)
30 Théo Le Guenedal, Frédéric Lepetit, Thierry Roncalli, and Takaya Sekine, “Measuring and Managing Carbon Risk in Investment Portfolios,” (2020). Link. (go back)
31 Emanuele Campiglio, Pierre Monnin, and Adrian von Jagow, “Climate Risks in Financial Assets,” CEP Discussion Note (Milan: Centro Europa Ricerche, 2019). Link. (go back)
32 Patrick Bolton and Martin Kacperczyk, “Do investors care about carbon risk?” Journal of Financial Economics, Volume 142, Issue 2, 2021. Link. (go back)
33 Bernstein, Asaf, Matthew T. Gustafson, and Ryan Lewis. “Disaster on the horizon: The price effect of sea level rise.” Journal of Financial Economics 134, no. 2 (2019): 253-272. Link. (go back)
34 World Economic Forum. “Circular Water Solutions Are Key to Making Data Centres More Sustainable.” November 2024. Link. (go back)
35 “State and Trends of Carbon Pricing 2024,” World Bank, 2024. Link. (go back)
36 “Unpriced Environmental Costs: The Top Externalities of the Global Market,” S&P Global, 2024. Link. (go back)
37 Swiss Re. “CO₂NetZero Programme.” Accessed April 30, 2025. Link. (go back)
38 “Sustainability or Strategy: Bridging the Gap Between Climate Change and Long-term Value Creation,” FCLTGlobal, 2022. (go back)
39 “FCLTCompass 2023 Report,” FCLTGlobal, 2023. (go back)
40 “The CEO Shareholder: Straightforward Rewards for Long-term Performance,” FCLTGlobal, 2023. (go back)
41 “Walking the Talk: Valuing a Multi-Stakeholder Strategy,” FCLTGlobal, 2022. (go back)
42 Pucker, Kenneth P. “Companies are scaling back sustainability pledges. Here’s what they should do instead,” Harvard Business Review, 2024. Link. (go back)
43 Yao Yao, Yifan Zhou, and Yifan Zhang, “How Greenwashing Affects Firm Risk: An International Perspective,” Journal of Risk and Financial Management 17, no. 11 (2024): 526. Link. (go back)
44 International Foundation for Valuing Impacts. “Environmental Topic Methodology – Interim Methodologies.” Link. (go back)
45 Climate Scenario Catalogue. “Final 2024.” Link. (go back)
46 B Team. “Reform $1.8 Trillion Yearly Environmentally Harmful Subsidies to Deliver a Nature-Positive Economy.” Link. (go back)
47 Science Based Targets initiative (SBTi). Link. (go back)
48 UNEP Finance Initiative. “Net Zero Alliance.” Link. (go back)
49 Goldstein, John and Chex Yu. “Climate Metrics 2.0: Measuring What Matters for Real Economy Climate Progress.” Goldman Sachs Asset Management, 2023. Link. (go back)
Legal Disclaimer:
EIN Presswire provides this news content "as is" without warranty of any kind. We do not accept any responsibility or liability for the accuracy, content, images, videos, licenses, completeness, legality, or reliability of the information contained in this article. If you have any complaints or copyright issues related to this article, kindly contact the author above.
